The UK’s housing market is beginning to wobble, with worrying ramifications for property investors and landlords alike. The Nationwide House Price Index (HPI) indicates that house prices have continued to tumble in 2023, building on last year’s downward trend. Prices continued to fall into January, marking the fifth consecutive month of decreases, with prices now falling as fast as they did in 2008, following the financial crisis.
House prices fell by a further 0.6% in January, according to Nationwide, with the average UK house price currently £258,297. Prices stalled in September last year, followed by monthly falls of 1.0% in October, 1.2% in November and 0.3% in December. This means that the typical property price is 3.2% lower now than during the market’s peak in August of last year. Although this remains substantially above pre-pandemic levels.
Although house price growth stuttered to a halt across all regions of the UK, some areas have fared better than others. Perhaps understandably, it is the regions that witnessed the fastest house price growth which are now seeing the sharpest drawback in prices. The Southwest, Wales and the East Midlands have all seen the sharpest pullback in prices, whereas areas of the North and London have remained proportionally more sheltered to decreasing house prices.
Graph 1: Regional annual % change in house prices
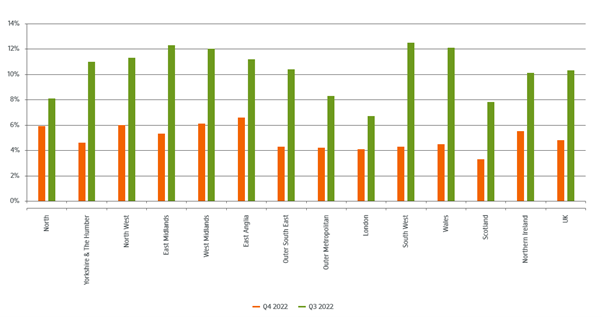
This chart is courtesy of the Nationwide Building Society House Price Index.
Robert Gardner, Nationwide’s chief economist, said: “There are some encouraging signs that mortgage rates are normalising, but it is too early to tell whether activity in the housing market has started to recover.
“The fall in house purchase approvals in December reported by the Bank of England largely reflects the sharp decline in mortgage applications following the mini-Budget. It will be hard for the market to regain much momentum in the near term as economic headwinds are set to remain strong, with real earnings likely to fall further and the labour market widely projected to weaken as the economy shrinks.”
He added: “Should recent reductions in mortgage rates continue, this should help improve the affordability position for potential buyers, albeit modestly, as will solid rates of income growth, especially if combined with weak or negative house price growth.
The Outlook for the Housing Market for the Rest of 2023
The recent fall in house prices may only be the start of a growing storm, with many industry bodies predicting that house prices will fall between 4-10% over the course of 2023. The market is being driven down by a toxic combination of economic headwinds. Rising energy costs have pushed up inflation, both in the UK and across the world, leading to the well-reported ‘cost of living crisis’ as household disposable incomes are eaten away. At the same time, the Bank of England has been forced to increase the Base Rate to combat spiraling inflation, pushing up mortgage costs and reducing affordability thresholds.
Whilst many market commentators believe there is a limit to how far interest rates will rise, the Bank of England chose to again hike interest rates from 3.5% to 4% on Thursday the 9th of February. The hike will continue to fuel declining house prices, with an immediate impact on homeowners with tracker mortgages. According to figures from UK Finance, the average tracker mortgage payment will increase by £48.99 per month. Equally, the average standard variable rate (SVR) mortgage will increase by £30.81 per month. SVRs are variable rates that borrowers find themselves on once their initial fixed term has expired. The average mortgage rate for new loans rose to 3.67% in December, the highest in a decade, according to Bank of England data published last week.
Data from The Royal Institution of Chartered Surveyors (RICS) suggests that things could well get worse before they get better. The RICS house price balance fell to minus 47 in January, down from minus 42 in December. The index reflects surveyor sentiment and the proportion of surveyors reporting a drop in prices. Its recent fall represents the 10th successive month of decline and is the lowest reading in nearly 14 years, since April 2009.
Is it All Doom and Gloom?
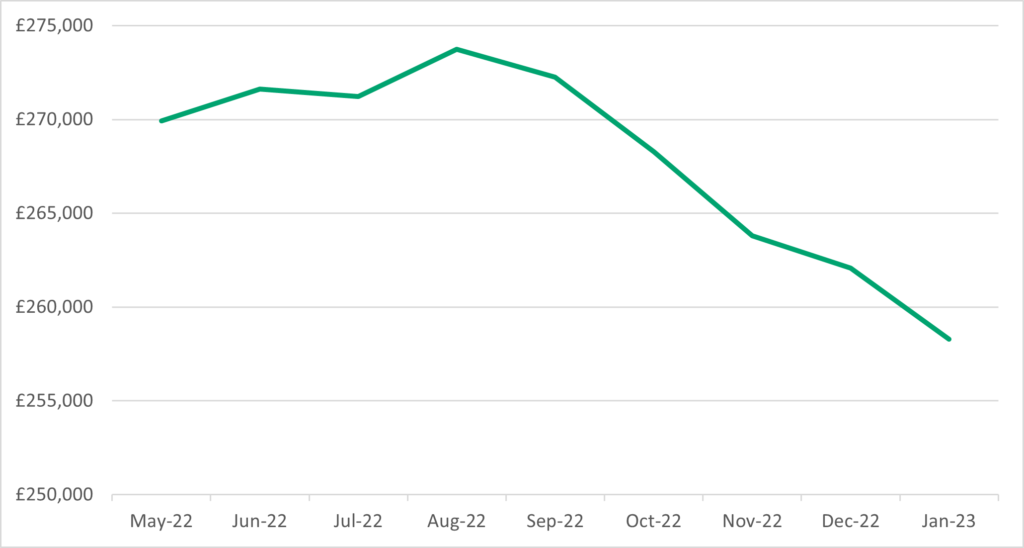
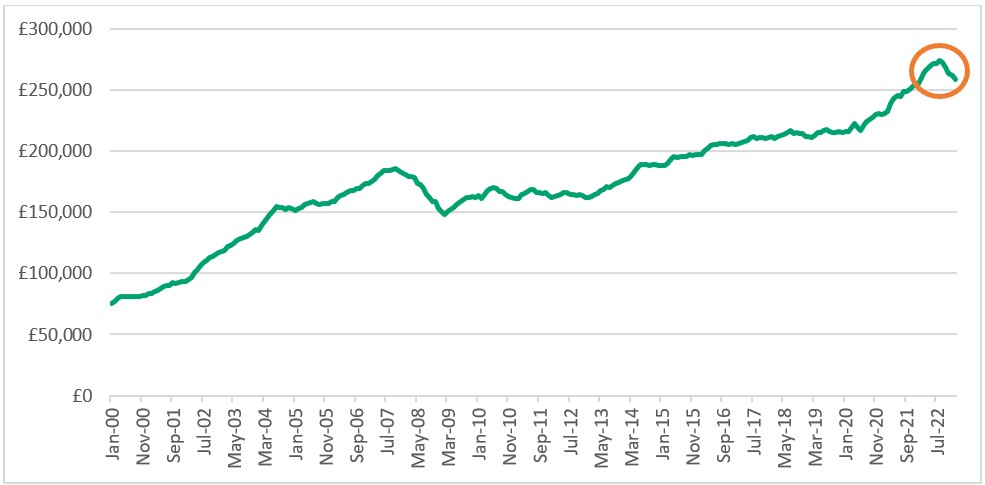
It is easy to be drawn into negative headlines and self-perpetuating negativity. Although the current environment is a tough one for landlords and property investors alike, it is worth framing it against the wider context. Whilst house prices may be beginning to fall at a worrying rate, they are still higher than they were in January 2022 and considerably higher than their pre-pandemic levels. When you take a step back from the short term, you can see that the recent fall may only be a road bump on the long-term trajectory of house prices – as seen in Graph 2 and Graph 3. House prices would need to fall a further 15% to merely reach their pre-pandemic levels, which would mean a similar peak-to-trough fall in house prices as experienced during the financial crisis.
Although it offers scant reassurance to landlords struggling to stay in the black, it is also worth noting that falling house prices are not unique to the United Kingdom. German house prices suffered their biggest six-month fall in more than 20 years in the second half of 2022. Mortgage rates in the United States surpassed 6%, with house prices falling in the last quarter of 2022. In some areas of the US, house prices are more than 10% below their market peak. The picture is even worse in Australia, with some commentators expecting house prices to fall by 10-25% over the course of 2023.
Graph 2: Average house price performance since May
Graph 3: Average house prices since 2000
Finally, whilst house prices may be struggling, rents are set to rise. Demand for rented accommodation continued to rise in January, according to a net balance of 43% of respondents to RICS market survey. The same pressures which are squeezing landlords are also preventing many first-time buyers from getting on the property ladder, forcing them to turn to rented accommodation. Such rising demand for rented properties is also coinciding with a continuing exodus of landlords in the private rental sector, perpetuating the supply imbalance and forcing rents higher. Whilst this does offer some hope for landlords, dramatically rising rents may become a double-edged sword and encourage populist government policy to restrict rents and further hinder landlords.