In this post, we’re sharing some tips and resources that you will need to conduct thorough property research. We will take you through how to assess house prices, average rents, rental demand, and rental yields.
Before we start, you should know that a lot of this process is subjective. You’ll need to be honest with yourself about your property, level of input, expenses and what you will and won’t put up with. Anything less than this will skew your research.
How House Prices Will Affect your Property Investment Decision
If you are a serious investor, you’ll want to keep your eye on house prices. This doesn’t just apply if you want to buy or sell a property, house prices can also indicate what’s happening in the locality. For instance, if you know that house prices have been consistently rising, it could mean that the area is growing in popularity. Conversely, rising house prices could signify that more people are buying in the area, rather than renting, resulting in a decreasing rental demand.
House Price Data from The Land Registry
The best place to find house price data is on the Land Registry Website. The Land Registry is a government run service and it’s free to use. As with all things like this, lack of use can cause the service to go offline, so use it while you can!
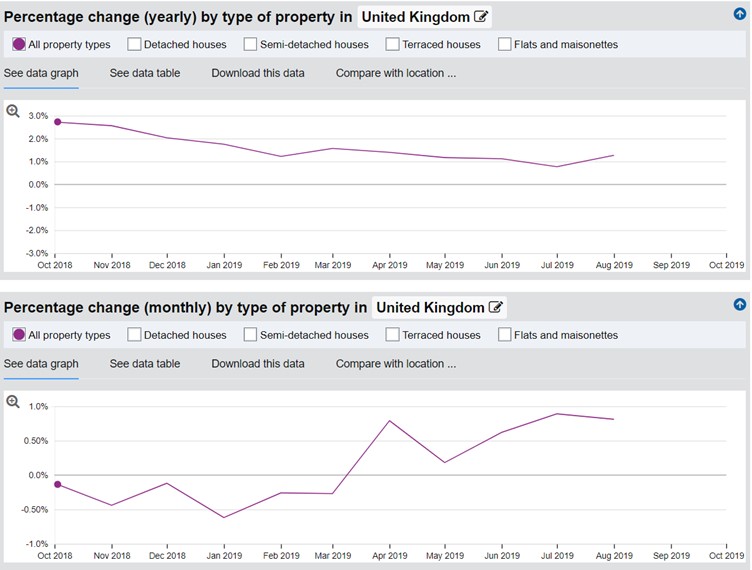
The data is updated monthly and runs a month behind, so for example in August you can only see data up to the end of July.
The data you can get from this site is phenomenal, it includes average house prices and recent movements in the market. You can also view the data by country, local authority, region or county and compare that data with a different county, region etc. You can download the data, see it in graph or table form, select a date range and even filter by house type. There’s a lot of very useful data here and this site is the best for getting a general feel for house prices in your area.
If the Land Registry site gets taken down, the best backup is the main government website. Each month they release a new article sharing the Land Registry data. It isn’t as useful or interactive as the Land Registry explorer, but you can access all the highlights and still get a good feel for market movements. As the land registry data is published monthly on the gov site, you’ll need to copy and paste this URL:
https://www.gov.uk/government/news/uk-house-price-index-for-march-2019
into the address bar and change the month and year you want the data to be displayed for. It runs a month behind, so if it’s August you can only see data from July or before.
House Price Data from The Prime Location Heatmap
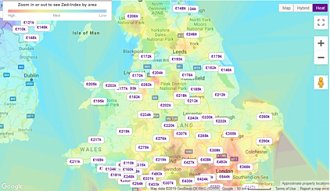
If the Land Registry seems like way too much data for you and you’d prefer to just dip in and get a feel for current house prices, Prime Location has a heatmap of property prices that is free and easy to use.
It works like Google maps so you can zoom in on areas you’re interested in. As you zoom in the average property prices appear.
If you just want a general idea to satisfy a thought, it’s a fine website. If you’re serious about investing though it’s worth putting in the leg work with the Land Registry.
Historical House Sale Data for Property Investors
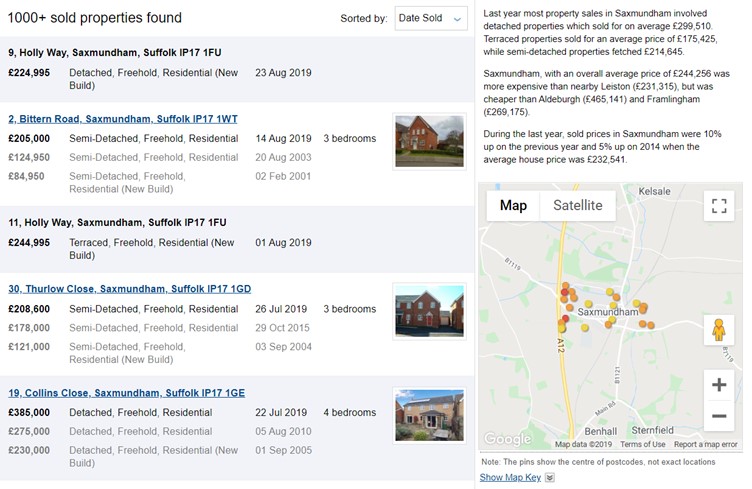
While it’s good to know what average house prices are doing, it’s also good to know how much houses have sold for historically. Using Rightmove you can find historical house sale data. You can use this data to find houses like the ones you’re looking to buy or sell. Going through this data will give you a much more granular projection of what you could expect to buy or sell a similar property for.
Average Rents for Rental Properties
This is one important piece of research that you’ll need to perform if you’re considering raising your rents or when deciding how much to set a rent price at before the property is tenanted.
Home is a great place to look at average rents as well as a lot of other useful information. However, when you are at the point of setting the price you will need to do a deeper dive.
Average rents don’t take into consideration key things about your property, like what type of house it is, what kind of tenants you’re thinking of renting to etc. For instance, if you want to rent to tenants on benefits, it’s no good setting the rent higher than average or investing in high end furniture and appliances, your prospective tenants won’t be able to afford it.
What Features Make a Property Sell for More?
Use Rightmove and Zoopla to look for rentals in the area where you have bought or are considering buying a property. Find properties similar to yours. Where the rent fluctuates look for reasons why. For example, a 4 bed terrace won’t sell for as much as a 4 bed semi. A 4 bed detached property will likely sell for more than a terrace or semi. Think about the neighbourhood too, properties within easy walking distance of transport links and amenities will be more expensive.
Once you’ve ruled out external factors think about the interior. A furnished home will have a higher rent than an unfurnished home and the décor makes a difference too. If the house is nicely done out in neutral shades with a new kitchen or bathroom it will fetch a higher rent than a house that’s tired and still painted in various shades a la the eclectic tastes of previous owners.
The outside of the property can also impact the rental price. If the property has a parking space or garden it will fetch more than one that doesn’t. If the garden is tidy and well looked after or is an easy-care garden it will be worth more than a property whose garden looks like an ode to nature. When looking at these things you will need to take as much of this into account as possible, therefore you need to look at the rental prices for properties very much like yours.
Decide Your Rental Prices by Finding More Specific Rent Data
To do a deep dive head to Rightmove or Zoopla (or SpareRoom for HMO’s). Click into the rental section of the site and enter the first part of the postcode of your property or the postcode of the area you’re considering investing in.
Use the filter options on each site to narrow the search down to properties like yours. You can select the number of bedrooms and property type which will help hone the results. On both sites you can tick a box to also show let agreed properties, these properties have been successfully let and you’ll see the amount of rent the landlord is receiving from the property.
When using Zoopla click into the advanced search options to include let agreed and to set a distance from your location. When you get the results, you can use the filter to include or exclude furnished and unfurnished properties and house types which makes the search much easier.
On Rightmove, when you search, a black bar appears at the top of the screen, by clicking property type you can hone the property type and select or deselect the furnishing options. You can also click on filters to include or exclude house shares, garden status parking and more.
Of course, if you have a rent figure in mind, you can also search for rentals at that specific price. If the properties that come up are consistently better than yours, you’ll need to consider a lower rental amount, if yours is better than everything that comes up then you may be able to charge more.
Rental Prices for Social Housing
If you’re renting to social housing tenants consult the list of Government rates for housing benefits. This explains how much the government will pay out for different types of property in different categories. The more you charge above this rate the less likely you are to find a tenant for a social housing property.
Rental Demand for Investment Properties
When considering a property investment, you’ll want to know what rental demand is like. If there’s not much demand, you’ll find it harder to rent a property.
Check how long properties have been on the market using Rightmove and Zoopla (or SpareRoom for HMO’s). If there are many properties on the market that have been there a long time, then it’s an indication that rental demand is low.
Look at let agreed properties, if there are, for instance, 50 properties to let in that area and only two have been let in the last month it indicates a lower rental demand. If you’re seeing 50 properties and 20/30 of those are let agreed, then it indicates there’s good demand.
Look at how long the properties have been on the market, if it’s a long time for a lot of properties then again it signifies a lower demand. If it’s taking days or a few weeks to rent out that’s about where you want it to be, but if you’re looking at months on the market the location isn’t exactly thriving.
Rental Yields
The average rental yields in an area are an important consideration when it comes to planning out how much you can expect to make from your investment. At best the figures will be estimates. A landlord’s true net yield also accounts for running costs and expenses and this will differ from landlord to landlord.
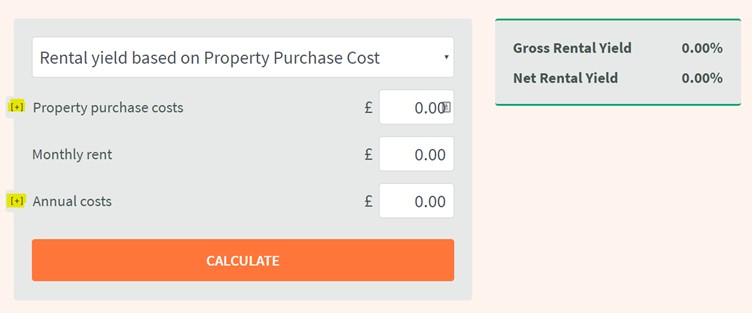
If your property is old and requires regular maintenance your yield will be lower than a new build property in the same neighbourhood with the same rent. It’s always best to take the average yield as an indicator that a location has potential, but you should always carry out a comprehensive yield calculation before investing. The rental yield calculator on the Landlord Vision website will allow you to do this.
Search online for: “average rental yields” and you’ll be confronted with a lot of blog posts talking about the top property hot spots. Articles like this can be useful for a general overview but remember they don’t take specifics into account. These figures are highly subjective, use them to guide you but do your own honest calculations and you’ll be much better informed.