Maths and metrics aren’t everyone’s cup of tea. Few things can strike fear into the heart of practically-minded people more than the thought of formulas and abstract calculations. However, in a time when the profitability of traditional buy-to-let investments is being called into question, it is imperative that landlords are equipped with the metrics needed to make sound investment decisions. Whether you are weighing up whether or not to purchase a property or assessing the performance of your portfolio, it is vital that you have accurate and measurable metrics to compare against.
The metrics available to landlords can range from simplistic occupancy rates and gross yields, all the way through to more complex internal rates of return (IRR) calculations and abstract capitalisation ratios. The aim of this guide is to provide landlords with a detailed, but accessible, breakdown of the key metrics and KPIs used in the property investment industry, why they are important and how they can be worked out.
Gross Rental Yield
Whilst it may sound less than savoury, gross yield is one of the simplest and readily understandable metrics available to landlords. A property’s gross yield shows its profitability before taxes and expenses are deducted. It is conventionally expressed as an annual percentage return. The more cash your property generates, the higher the gross yield.
So why is the gross yield an important metric to measure? The gross yield of a property helps to demonstrate its income generation potential before the complexity of mortgages and other costs are brought into the equation. Effectively how much cash the property generates, relative to its purchase price. As a result, gross yield metrics provide a quick top-line metric with which to compare multiple different properties by:
The Formula for Gross Rental Yield
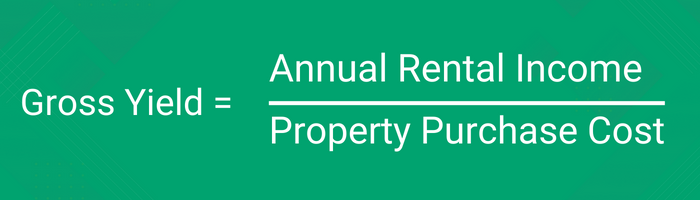
Annual Rental Income: the annual rent generated by the property.
Property Purchase Cost: the total cost of purchasing a property, including its sale price and any additional costs such as Stamp Duty or legal fees.
** As the gross yield of a property is typically used as a simple, top-level metric, some landlords opt to just compare the property purchase price without accounting for additional costs of purchase.
An Example of Gross Rental Yield
Let us imagine you have purchased a property for £192,000, with a further £8,000 of purchase costs, giving a total property purchase cost of £200,000. The property has since been let for £950 per month, giving an annual rental income of £11,400. This information can be easily plugged into the gross yield equation to work out the percentage return of the property.
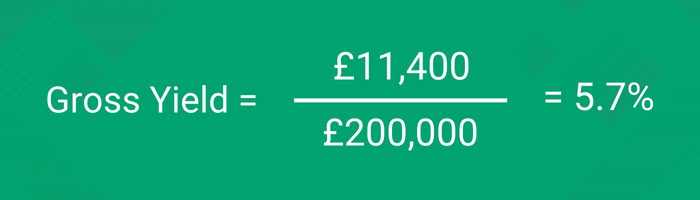
As you are generating £11,400 of annual income from your £200,000 property, it can be calculated that it is generating a gross rental yield of 5.7% per annum.
Net Rental Yield
If the gross yield gives you a top-level overview of the cash generation of your property, the net rental yield provides a more accurate representation of its actual profitability. The net yield of a property shows its annual percentage profitability once all expenses have been accounted for.
In many ways, the net rental yield figure is significantly more important than the gross yield as it demonstrates how much profit your property is actually generating each year. The higher the net rental yield of a property, the more money you will have in your bank account at the end of each year.
Net Yield Formula
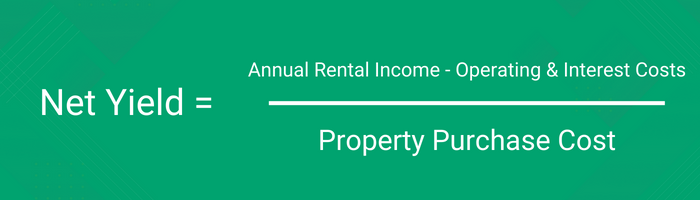
Annual Rental Income: the annual rent generated by the property.
Operating & Interest Costs: all costs associated with operating your investment property, including letting agent fees, maintenance costs, void periods and mortgage interest payments.
Property Purchase Cost: the total cost of purchasing a property, including its price and any additional costs such as Stamp Duty or legal fees.
An Example of Net Rental Yield
Expanding on the gross yield example we used previously. If you purchased a property for a list price of £192,000, with an additional £8,000 of expenses accrued in the purchase, your total purchase cost would be £200,000. However, we now need to compare this against the net rental income of a property, which is the total annual rental income of £11,400 minus any operating and income costs.
Hypothetically, you may have taken out a £100,000 mortgage against the property and locked in a favourable rate of 3% per annum, which gives an interest-only mortgage cost of £3,000 each year. On top of this, you have set aside a maintenance fund of 10% of the annual rental income, equivalent to £1,140. Furthermore, you have employed a letting agent to manage the property, paying them 9% of the monthly rent (£1,026). Combined, this comes to £5,166 in annual operating and interest costs, giving a net income of £6,234.
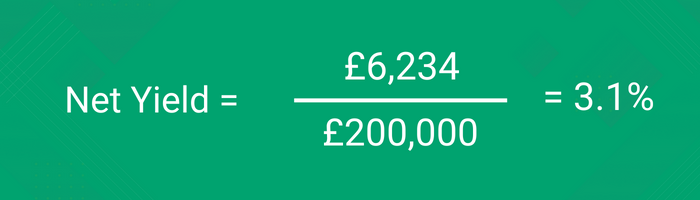
As you are generating £6,234 of annual net rental income from your £200,000 property, you can work out that it is generating a net rental yield of 3.1% per annum. This is significantly lower than the gross yield of 5.7%.
Capitalisation Rate
Along the same lines as the net yield, the capitalisation rate is a particularly popular metric used by corporate financiers and commercial property investors. However, it is equally applicable to residential property landlords. In essence, it is strikingly similar to the net yield metric. However, whilst the net yield looks at returns generated relative to the property’s purchase cost, a property’s capitalisation rate focuses on its present market value.
By contrasting the net operating income (NOI) of a property against its current estimated market value, investors are able to compare the current potential returns of a property. The metric also helps to shed light on the perceived market risk of the property. The higher the relative return, the more theoretically risky the market deems the property to be.
Capitalisation Rate Formula
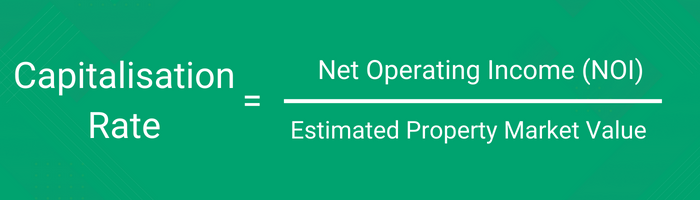
Net Operating Income (NOI): the rent a property generates after operating expenses, such as letting agents, insurance, utilities and maintenance are deducted, but before deducting for interest and tax.
Estimated Property Market Value: a fair estimation of the sale price of the property, where it is to be sold at the current moment in time.
** Note that the net yield compares net income after interest payments are accounted for, whilst the capitalisation rate does not.
Capitalisation Rate Example
You may still be questioning the difference and thus the importance of the capitalisation rate versus a simple net yield calculation. However, the value of this metric can be better evidenced by the following example. Let us again assume the purchase of a property for £200,000 including purchase costs. After all annual expenses are deducted, the property generates a net income of £6,234, equivalent to a net yield of 3.1%.
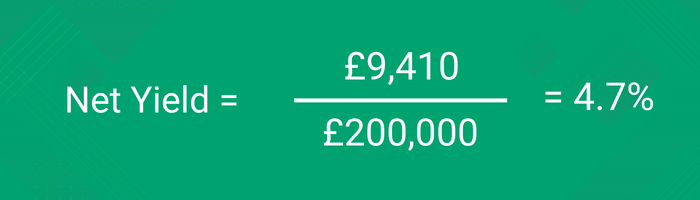
Let us now imagine that a decade has passed, and the rent has increased at an average rate of 3.0% per annum. The property now generates a rental income of £15,321 and a net yield of £9,410, with mortgage interest payments still fixed at 3.0% per annum. However, in the same period, the house price has more than doubled to £400,000. In this example, the net yield on this property has now increased from 3.1% to 4.7%.
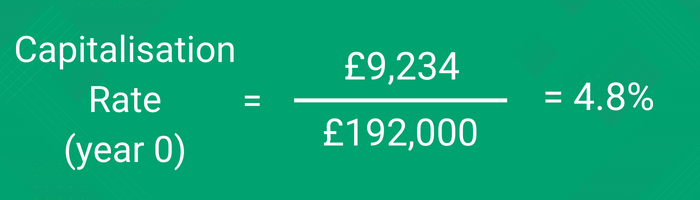
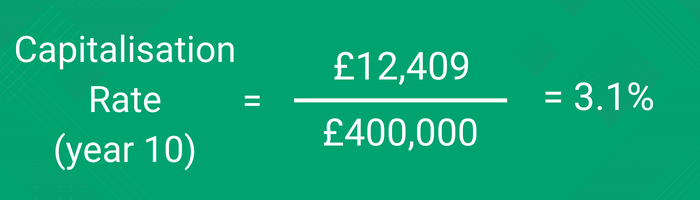
In comparison, the capitalisation rate reflects the current market value of the property. At the time of purchase, the property’s capitalisation rate was 4.8%, with a net operating income of £9,234 and a market value of £192,000. However, at the end of the decade, the property’s capitalisation rate has fallen to 3.1%, with a net operating income of £12,409.
So, what does this tell us? Firstly, the net yield demonstrates that, as rental income has increased, so too has the net yield of the property. Therefore, the original investment is even more profitable relative to the original purchase price. However, the capitalisation rate shows a stark contrast. Whilst the property’s rent has grown, its market value has grown at an even faster rate. Therefore, although the property remains profitable, its rate of return relative to its market value is now worse than it was at the time of purchase. This suggests that, if there are properties with higher capitalisation rates on the market, it may be worth selling your property and re-investing into another property which generates a higher return at the current moment in time.
Return On Investment (ROI)
Without a doubt, one of the most important metrics associated with property investment is the concept of ‘return on investment’, usually referenced by the acronym ROI. Simply, this metric is the be-all and end-all. It shows the profit you will generate from an investment relative to the amount of capital you will need to invest. When you peel away all of the flowery formula and technical jargon, it demonstrates how hard your money is working for you. The higher your percentage ROI, the better the investment.
In the property world, return on investment is typically expressed as a percentage return over a given period, such as a year. That is, how much profit your property investment will generate over this period of time? This is done by comparing your net rental income against your initial cash investment.
What makes the return-on-investment metric so important is that it accounts for the use of leverage. That is, it takes into consideration the effect that a mortgage may have on your returns, splitting out your actual cash investment and determining the rate of return this generates. What makes the return-on-investment metric so important is that it accounts for the use of leverage. That is, it takes into consideration the effect that a mortgage may have on your returns, splitting out your actual cash investment and determining the rate of return this generates.
Return On Investment Formula
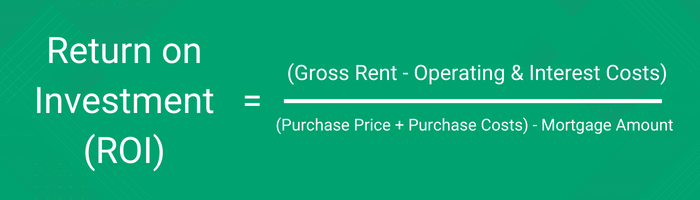
Gross Rent: the annual rental income you receive from a property before any deductions are made.
Operating & Interest Costs: all costs associated with operating your investment property, including letting agent fees, maintenance costs, void periods and mortgage interest.
Purchase Price: the price agreed with a seller to purchase their property.
Purchase Costs: the costs accrued in purchasing a property such as Stamp Duty, legal costs, searches and surveys.
Mortgage Amount: the total value of the mortgage taken out against a property.
Return On Investment Example
For example, let’s say you are trying to work out the potential profitability of a property. It is listed for £210,000 but you believe the vendor will accept £200,000. From experience, you know that you will need to pay £6,000 in stamp duty, £1,500 in legal fees and £300 in searches. For peace of mind, you also intend to carry out a survey on the property, at a cost of £750. This means that you expect to pay a purchase price of £200,000 plus purchase costs of £8,550. To maximise your return, you intend to take out a 75% loan-to-value mortgage on the property, borrowing £150,000 at a rate of 5% per annum. Therefore, you will need to invest £58,550 of your own money into the property to pay for the deposit and purchase costs.
Thankfully, being an astute investor, you know that you can let out your property for £1,250 per month, or £15,000 per annum. Equally, you will be managing the property yourself, so won’t need a letting agent. However, you expect to pay maintenance costs equivalent to 10% of the annual rent, so set aside £1,500 per annum. As you have an interest-only mortgage, you calculate that you will need to pay £7,500 per year in interest payments. Finally, you expect that the property will be vacant for 2 weeks per year on average, costing you £625 in lost rent, plus a further £200 in ancillary costs. Therefore, your total operating and interest costs come to £9,825 each year.
Gross Rent (£15,000): assuming the property is let for £1,250 per month.
Operating & Interest costs (£9,825): accounting for £7,500 in interest costs, £1,500 in maintenance costs and £825 in void costs.
Purchase Price (£200,000): assuming that the vendor will accept a discounted amount.
Purchase Costs (£8,550): the sum of £6,000 in accrued Stamp Duty, £1,500 in legal fees, £300 in search costs and £750 in property survey costs.
Mortgage Amount (£150,000): taking out a 75% loan-to-value mortgage on an assumed purchase price of £200,000.
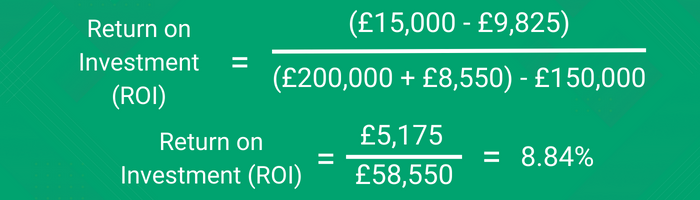
As you can see, the expected return on investment of purchasing the property is 8.84% plus any capital appreciation. This means your actual cash investment will return 8.84% per year, all things being equal.
Internal Rate of Return (IRR)
A property’s internal rate of return (IRR) is where things start to get a bit more complex. As such, this metric is more commonly found in commercial property analysis. Similarly to working out a property’s ROI, the internal rate of return aims to tell investors the average annual return they have either realized or can expect to realize from a property investment over time, expressed as a percentage. Where the IRR differs is that it takes into account cashflows which vary over time.
Over the life of a property investment, which typically lasts for at least a few years, investors receive a series of regular payments from tenants, as well as a larger lump sum once a property is sold. There may also be a refinancing or some other event that creates additional cash proceeds. Because these cash flows occur over many months or years, their relative value isn’t equal, due to the nature of inflation and time. As the saying goes, a bird in the hand is worth two in the bush. By the same token, a pound of cashflow today is worth more than a pound of cashflow in five years’ time.
The value of using the IRR metric to assess prospective deals or analyse performance is that it accounts for both capital appreciation (property prices increasing) and the effect of inflation on your income, as well as rental income. This helps to give a more comprehensive overview. However, as a tool for measuring prospective properties, it relies on more assumptions and thus can be more prone to error.
Internal Rate of Return Formula
The formula for working out the internal rate of return on a property is a bit of a beast, so don’t worry if it doesn’t immediately make sense. There are multiple online calculators that can do the working out for you or the most up-to-date versions of Excel have the function built in for you to work the metric out.
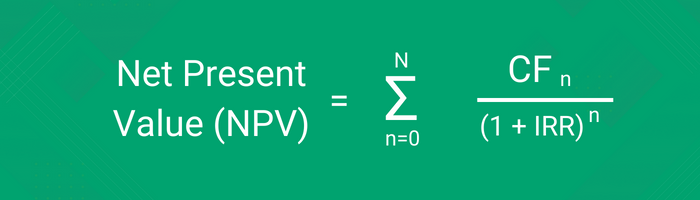
N: the number of years you own a property.
CFn: the prospective cash flow from a property.
n: the current year or stage you’re in when calculating the formula.
NPV: the net present value of future cash flows.
IRR: the internal rate of return.
Internal Rate of Return Example
Let’s assume you go out and buy a property for £100,000, with an expected rental income of £500 per month or £6,000 per annum. You intend to hold the property for the next five years at which time you think it will be worth around 50% more or £150,000. At this point, you may either sell the property or refinance your five-year fixed mortgage.
Therefore, your payment profile would look something akin to this:
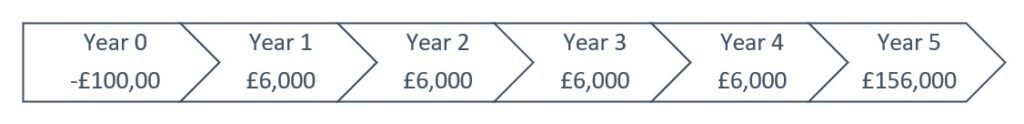
Plugging the cashflows above into Excel and using the IRR function on the formula tab gives us an estimated IRR of 13.6% per annum. In comparison, using an ROI calculation would give an ROI over the period of 80% or an annualized ROI of 12.47%.
If you want to get bogged down in the detail of how it is calculated, there are plenty of financial articles online outlining it. However, for the majority of readers, I would recommend relying on one of the following tools:
Calculator.net: a great tool for calculating the IRR. It also has a number of other calculators which are generally useful. The downside is that it allows for a lot of variables, so it appears more complex. It is also expressed in dollars not pounds.
Sparkrental.com: A simpler tool which allows you to input each cash flow manually. It is also expressed in dollars not pounds.
Operating Expense Ratio (OER)
Simply, the operating expense ratio (OER) is a measurement of the cost to operate a property, compared to the income it generates. The metric helps landlords to assess the expenses generated by properties in their portfolio and contrast them against other similar properties. High OERs suggest higher-than-average maintenance costs, management fees or other ancillary costs.
So, what should be included in the operating expenses of a property and what should not? Property management fees, utilities, waste removal, maintenance, insurance, repairs, council tax, and other costs should be included in OERs. Additional operating expenses that investors might model into the OER include landscaping, legal fees, landlord’s insurance, and basic property insurance. These costs help run the property on a daily basis. Non-daily expenses such as loan repayments and capital improvements should be excluded from any calculations of operating expenses.
Operating Expense Ratio Formula
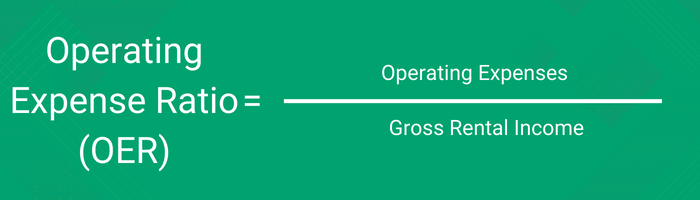
Operating Expenses: items such as property management fees, letting agent fees, maintenance, insurance, council tax, insurance and other daily recurring expenses incurred by the running of a tenanted property.
Gross Rental Income: the annual rental income generated by a property before any deductions are applied.
Operating Expense Ratio Example
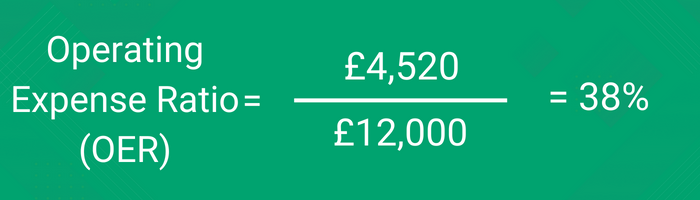
The operating expense ratio provides a good indication of the relative running costs of different properties. Let us imagine a property which generates £1,000 per month in rent or £12,000 per year. Over the course of the year, the property generates the following expenses:
| Expense Type | Monthly Cost | Annual Cost |
| Ground Rent | £0.00 | £500.00 |
| Management Agent Fee | £125.00 | £1,500.00 |
| Letting Agent Fee | £100.00 | £1,200.00 |
| Maintenance Costs | £95.00 | £1,140.00 |
| Insurance | £15.00 | £180.00 |
Therefore, the property generates total operating expenses of £4,520 per year. This equates to an operating expense ratio of 38%.
Occupancy Rates / Vacancy Rates
A property’s occupancy rate or vacancy rate demonstrates the proportion of time it spends unoccupied over a period of time. Vacancies tend to occur at the end of a tenancy when one tenant moves our and before another moves in. It is not uncommon for properties to spend a number of weeks listed for rent, before another tenant takes up the tenancy agreement, depending on the location.
Occupancy and vacancy rates help to demonstrate the relative attractiveness of a property. The lower the vacancy rate, the more attractive the property can be assumed to be, as tenants are reluctant to move out and prospective tenants are keen to snap it up as soon as it comes to market. Low vacancy rates may suggest that the property has a good, long-term tenant or that its rent is potentially below market value.
Occupancy & Vacancy Rate Formula

Number Of Days Vacant: the number of days the property spends without an active tenancy agreement in place.
Number of Days Tenanted: the number of days the property spends with an active tenancy agreement in place.
Occupancy & Vacancy Rate Example
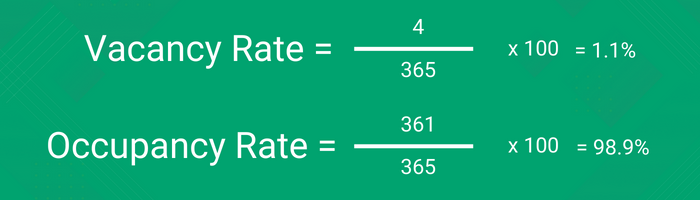
Let us assume a popular London flat located in a highly sought-after location. Over the course of the year, the initial tenant in situ opts to move out. The property is listed on the market for 4 days before another tenant is found. As such, the property has a vacancy rate of 1.1% equivalent to an occupancy rate of 98.9%.
Loan To Value (LTV)
Loan To Value is one of the most popular property investment metrics used by landlords and property investors. It is the ratio of what you borrow as a mortgage against how much you pay as a deposit and is usually expressed as a percentage of the property price.
A property’s LTV tells you a lot about its financial position. The higher the LTV on a property, the more highly levered it is – meaning the landlord has less equity in the property. Banks deem higher LTVs as inherently riskier, as there is less equity to act as a buffer should property prices fall. However, on the other side of the table, landlords employ higher LTVs to make their money go further and to benefit more from rising house prices.
Loan To Value Formula

Mortgage Amount: the value borrowed against the property as a mortgage.
Property Value: the market value or price paid for a property.
Loan To Value Example
Let’s take the example of a property originally purchased for £200,000. At the time of purchase, the landlord takes out an interest-only mortgage for £150,000 and puts £50,000 down as a deposit. This gives a property LTV ratio of 75%, as demonstrated below:

As time progresses, the property doubled in price and now has a market value of £400,000. The outstanding mortgage amount remains £150,000 as the landlord has only paid the interest each year and has not paid down the principal. Due to the rise in value, the property’s LTV has fallen dramatically to 37.5% as can be seen below:

Total Portfolio Equity (TPE)
Your total portfolio equity value is a key metric, demonstrating the real value of your properties as a whole. The metric takes the current estimated market value of your properties and deducts any outstanding mortgages and loans to give your overall equity in the portfolio. In essence, your total portfolio equity tells you what the net worth of your properties is and how much you would have in your bank were you to sell off your properties at market value. When all is said and done, it is far better to have a portfolio with £600,000 of total portfolio equity, than it is to have a property portfolio worth £2 million with a 75% loan-to-value.
Total Portfolio Equity Formula
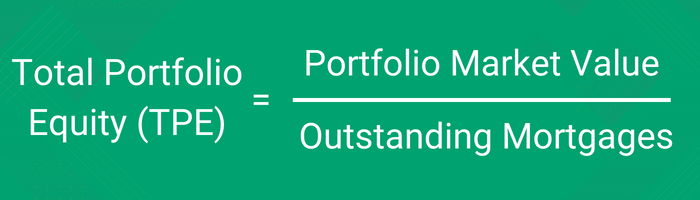
Portfolio Market Value: the sum of the estimated market values of all the properties in your portfolio.
Outstanding Mortgages: the sum of all the outstanding mortgage balances across all of your properties.
Total Portfolio Equity Example
Hypothetically, there could be two different property portfolios. The first one consists of six properties with a total market value of £3 million and a portfolio loan-to-value of 80%. The second one consists of four properties with a total market value of £1.6 million and a loan-to-value of 40%.
Portfolio One:
- Portfolio Market Value = £3 million
- Portfolio LTV = 80%
- Outstanding Mortgage Value = £2.4 million.
Portfolio Two:
- Portfolio Market Value = £1.6 million
- Portfolio LTV = 40%
- Outstanding Mortgage Value = £640,000
Portfolio One TPE = £3 million – £2.4 million = £600,000
Portfolio Two TPE = £1.6 million – £640,000 = £960,000
As you can see above, whilst Portfolio One may have a market value worth nearly twice that of Portfolio Two, its TPE is £360,000 less. Therefore intrinsically, Portfolio Two is more valuable. By looking at the TPE, we can see that Portfolio Two is more secure and has the capacity to increase borrowing to fund further purchases if needed. Whereas Portfolio One is operating at the higher end of the loan-to-value spectrum.
Interestingly, were property prices to rise by 30%, the equity position of the two portfolios would change dramatically. Portfolio Two’s TPE would increase by £480,000 to £1.44 million. In comparison, Portfolio One would see its TPE rise by £900,000 to £1.5 million as it benefits from being more highly levered.
Interest Coverage Ratio
The interest coverage ratio is a popular metric employed by banks and lenders to assess the riskiness of a loan on a buy-to-let property. It can often also be referred to as the debt-service coverage ratio. The metric compares the gross rent of a property against the debt service costs. This is then presented as a percentage figure, the higher the percentage, the safer or more secure the loan is deemed to be. In practice, the lower the interest coverage ratio on a property, the less room there is for landlords should anything go wrong.
Interest Coverage Ratio Formula
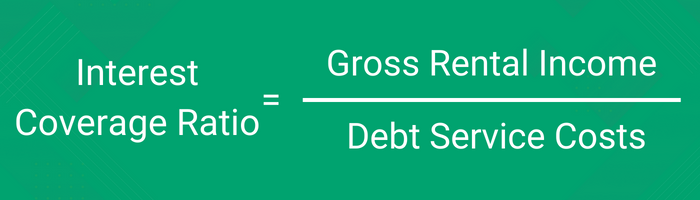
Gross Rental Income: the annual rental income generated by a property before any deductions are applied.
Debt Service Costs: the monthly borrowing costs associated with a mortgage, including interest payments and principal repayments.
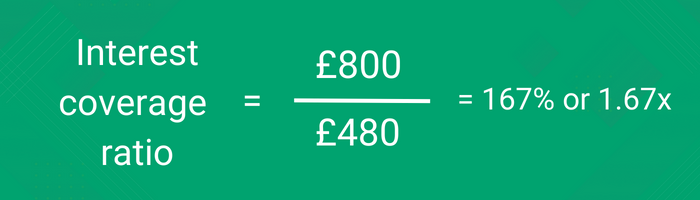
Interest Coverage Ratio Example
The interest coverage ratio is a relatively simple metric to calculate. You can simply take the monthly rent a property will generate and compare it against the monthly costs of its mortgage. If a property is let out for £800 per month and has mortgage costs of £480 per month, then the interest coverage ratio can be calculated to be 167% or 1.67 times the mortgage costs. Each bank will have its own minimum interest coverage ratios depending on the current state of the market and its own lending policies.
Portfolio Interest Coverage Ratio (PICR)
Very similar to the interest coverage ratio, the portfolio interest coverage ratio (PICR) looks at the aggregate rental coverage ratio of properties across an entire portfolio. Lenders typically look for portfolio interest coverage ratios of 125% or more, when calculated using a stressed interest rate. The stressed interest rate applied, will model the prospect of interest rates rising.
Portfolio Interest Coverage Ratio Formula
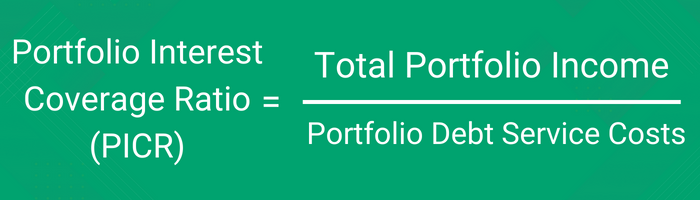
Total Portfolio Income: the annual rental income generated by all the properties in a portfolio before any deductions are applied.
Portfolio Debt Service Costs: the monthly borrowing costs of all the properties within a portfolio, including interest payments and principal repayments.
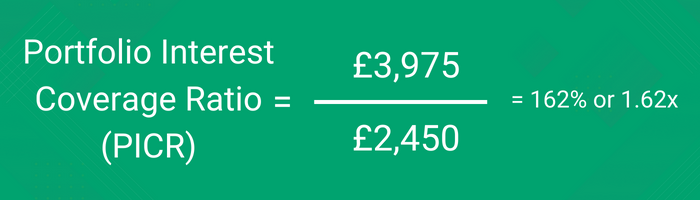
Portfolio Interest Coverage Ratio Example
As the portfolio interest coverage ratio is simply an aggregation of the interest coverage ratio across multiple properties, it is a relatively simple metric to calculate. Let us imagine a portfolio comprised of five properties, with the following monthly rental incomes and mortgage costs:
| Properties | Rental Income (PCM) | Mortgage Costs (PCM) |
| Property A | £800.00 | £480.00 |
| Property B | £625.00 | £330.00 |
| Property C | £500.00 | £265.00 |
| Property D | £1,100.00 | £835.00 |
| Property E | £950.00 | £540.00 |
| Portfolio | £3,975.00 | £2,450.00 |
When the rental income of all the properties is aggregated together, it can be seen that the portfolio generates an income of £3,957 per month. At the same time, the properties have a total mortgage cost of £2,450. This gives a total portfolio interest coverage ratio of 162% or 1.62x.